by Nikos Mattheos, DDS, MASc, PhD
“What a difference a millimetre makes?”
That was the question we posed some time ago, trying to understand the clinical benefits brought by the computer assisted implant surgery. But it appears we had our eyes on the wrong outcome! Today we take a closer look to a whole different picture!
While dissecting more than 250 clinical studies, including our own, a famous millimetre seemed to be what dominated the results of most papers: the mean deviation at the implant platform when an implant is placed with guided surgery. Since then I had countless discussions with colleagues and friends all over the world. Nobody seemed really satisfied with how this millimetre translates into a meaningful clinical parametre. Sceptics would see this millimetre maybe as too little to justify a major investment, while advocates felt that this millimetre simply does not reflect the true benefits they experience with guided surgery.
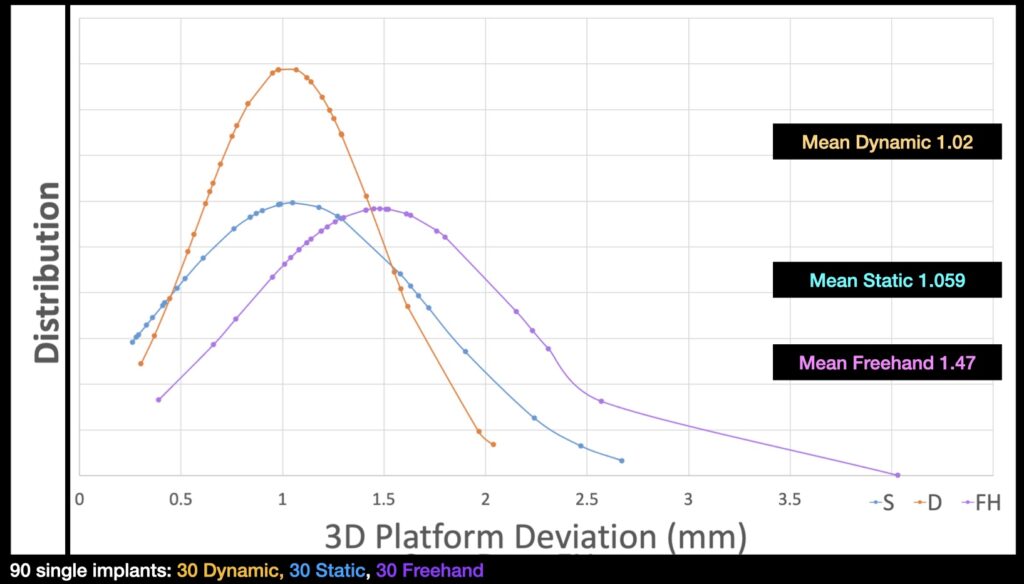
And then the realisation hit us. We were just looking at the problem from the wrong angle. We let this millimetre dominate our understanding of a new technology, when in reality this millimetre never existed anywhere else other than our statistics. It was all due to the “mean”, the average, maybe the most overrated and least useful statistical parametre we can find to describe clinical data. And indeed, the average deviation of 1,02 mm which we get with guided surgery is certainly better than the 1,4 we get with freehand placement, but it says little about the actual benefits of the technology.
in reality this millimetre never existed anywhere else other than our statistics. It was all due to the "mean"
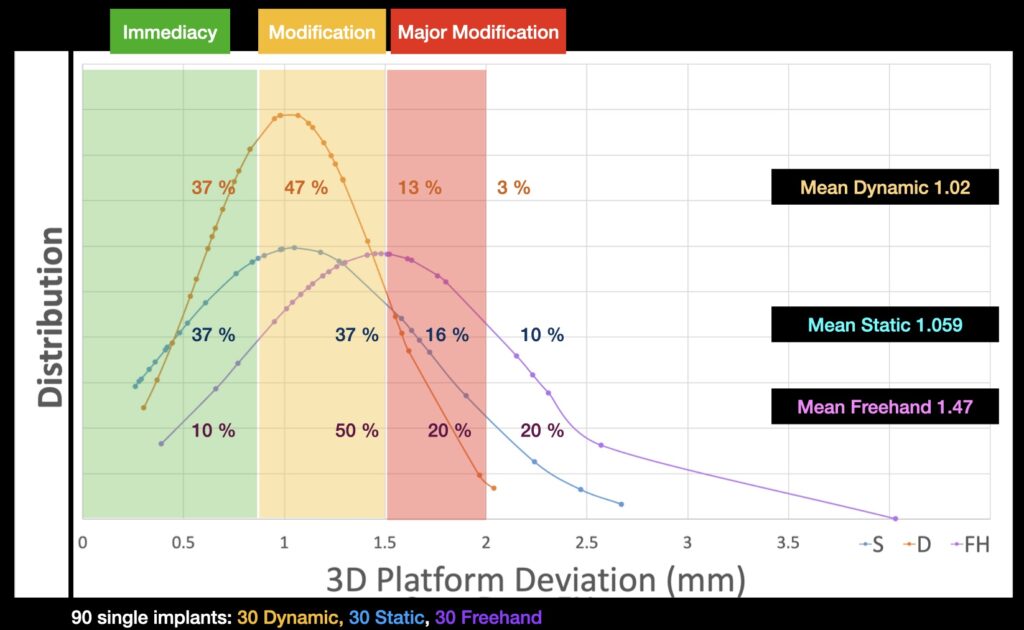
So we decided to do something very simple, so simple that it was never considered in any study before. We re-analysed our data trashing the means and focusing on the frequencies instead. We did a pilot analysis based on the data from 90 patients randomly assigned to freehand, static and dynamic CAIS and we plotted the deviation from each of them in a frequency chart. What did we come up with? Three beautiful Bell curves. All three were beautiful, but all very different. Dynamic appears to be the most narrow, followed by the static and then the freehand stretching really wide.

What does this mean for clinical practice? A lot! Let’s say you have planned for immediacy, either an immediate temporary or immediate loading and your freshly milled prosthesis is patiently waiting at the chairside for your implants to be placed. Once your implants are placed, you try the prosthesis and there are 3 possible scenaria:
- “plug and play” immediacy, with good fit. Prosthesis in, patient out happy ending.
- b) “almost there” immediacy, not perfect, but you have to trim a bit here and add a bit there. With some experience we will make it happen chairside
- c) “forget about immediacy”, misfit it too much, we have to really adjust a lot. Come back in a couple of days.
How much deviation is the tolerance level for “plug and play” immediacy? Hard to say precisely, as usually the problem is deviation in angle and platform combined to a different extent. It also depends on the complexity of the reconstruction. But let me assume from experience, that usually I have an effortless fit with deviations well below 1mm, while I could still make chairside modifications for as much as 1.5 mm
Now the chart has some true clinical implications, as it becomes obvious that both dynamic and static CAIS will deliver plug and play immediacy in 40% of the cases, as opposed to only 10% for freehand. If we extend to include the small modification group then we see CAIS serving successfully as much as 80% of the cases. Think of the time and resources saved, the logistics and the patient experience and you have already a major benefit of CAIS, certainly not described in the previously reported means. That is of course if you follow an immediacy procedure. With a conventional loading protocol, the benefit of CAIS is probably not that important in clinical terms. But this is something we can accept, CAIS is not a vanity gadget, but rather a great tool that can deliver results as part of a complete digital workflow.

Another interesting observation here, did you notice that dynamic has more cases within the clinically acceptable margins than static CAIS? The mean has never been different, but maybe that was out blind spot as of today! Could it be that dynamic has actually a true and clinically important advantage over static? We will try to find out, re-analysing a massive amount of data gathered by several randomized trials. Any good statisticians out there, please raise your hands!
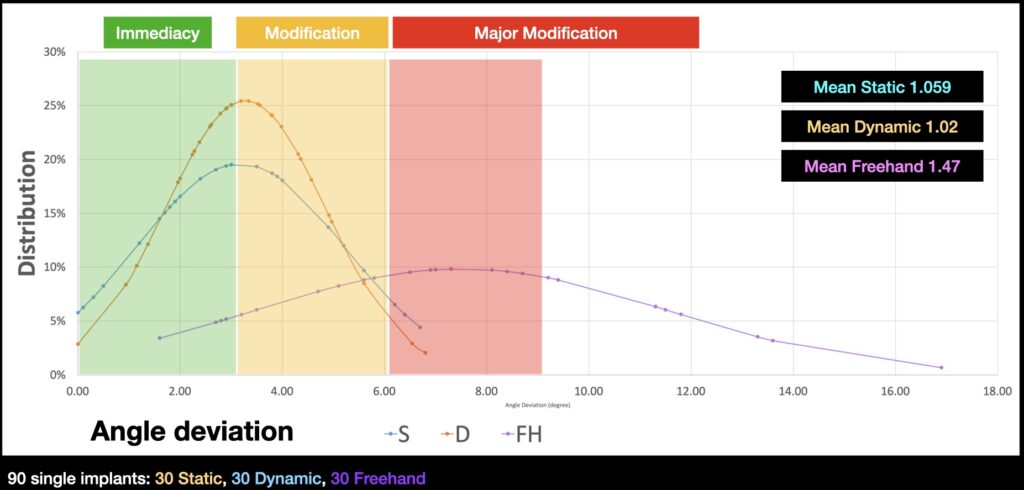
The picture is no difference when you look at the angle deviation, same here, with slightly different distribution. Maybe we will need to come up with some more concrete definition of what is “plug and play”, what is possible within the margins of chairside correction and what is too much when it comes to deviation. For this we would need to combine angle and platform deviation in some sort of synergistic relation. All suggestions welcome 🙂

..and a last question, could we somehow push the deviation curve closer to zero? I think we can and we have an idea how to do that…but everything in it’s time, let’s not spill the beans just yet! Talk more in our next article
Hear the latest news first: Subscribe to my newsletter!
Resources
- Can computer-assisted implant surgery improve clinical outcomes and reduce the frequency and intensity of complications in implant dentistry? A critical review September 2022, Perio2000.
- Computer Assisted Implant Surgery in Clinical Practice. April 2022, Dental Diaries.